
반도체 섹터 기술적 지지선 붕괴 시 리스크 관리 및 대응 시나리오 분석
지금 차트에서 벌어지고 있는 무서운 일들
Analysis of recent semiconductor stock price movements and the concept of technical support breakdown with charts and volume data.
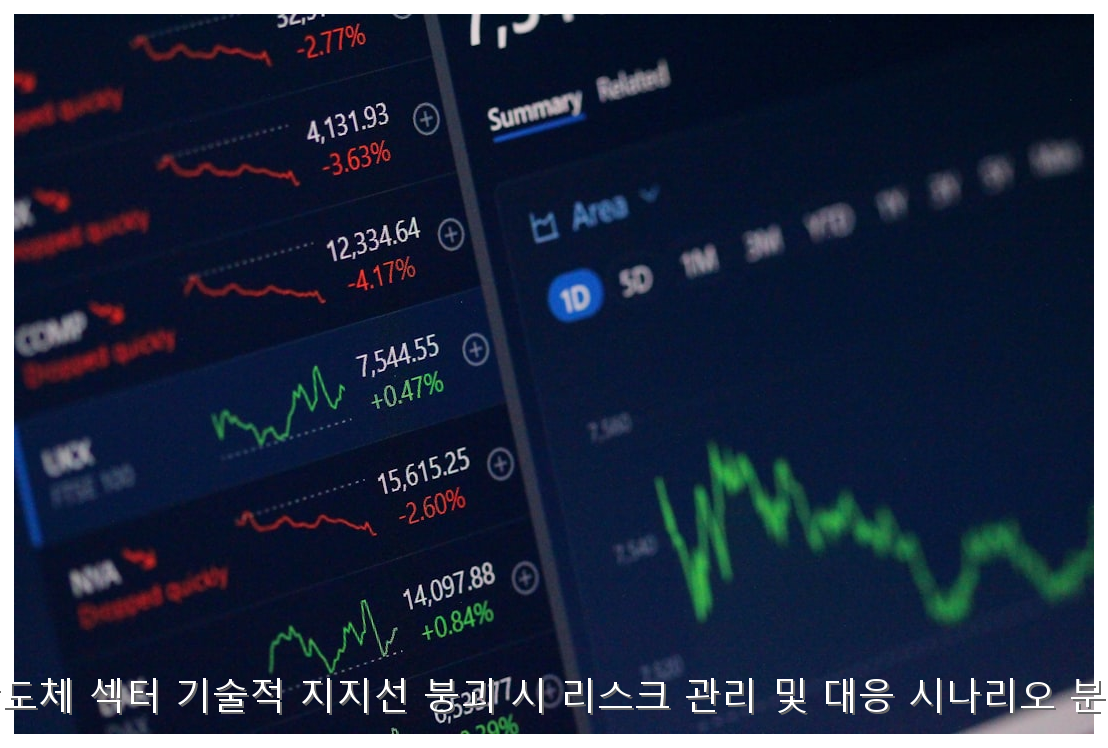
120일선의 배신과 기관의 매도 시그널
Detailed explanation of the 120-day moving average and how institutional algorithms react when it breaks.

가짜 이탈에 속지 마세요 휩소 구별법
Techniques to distinguish between a 'Whipsaw' (fake breakout) and a real trend reversal using volume and RSI indicators.
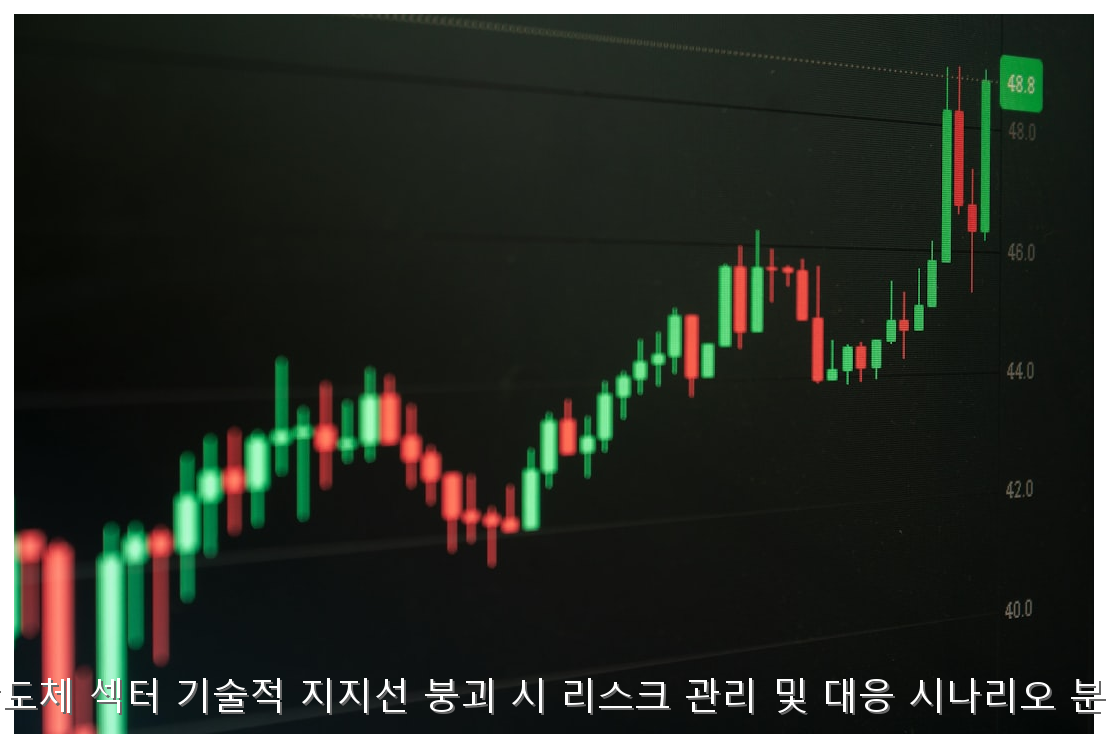
손절 타이밍 놓쳤을 때의 333 원칙
A tactical guide on the 3-3-3 rule: 3% additional drop, 3 days of waiting, and 3 split selling strategies.

HBM과 레거시 반도체의 디커플링 대응
Comparative analysis of high-growth HBM stocks versus traditional legacy semiconductor stocks during a market dip.
증권사 리포트의 이면 숨겨진 의미 찾기
How to read between the lines of analyst reports that maintain 'Buy' ratings during a price collapse.

반등의 서막 기술적 지표 RSI 활용법
Using the Relative Strength Index (RSI) to identify oversold conditions and potential reversal points.
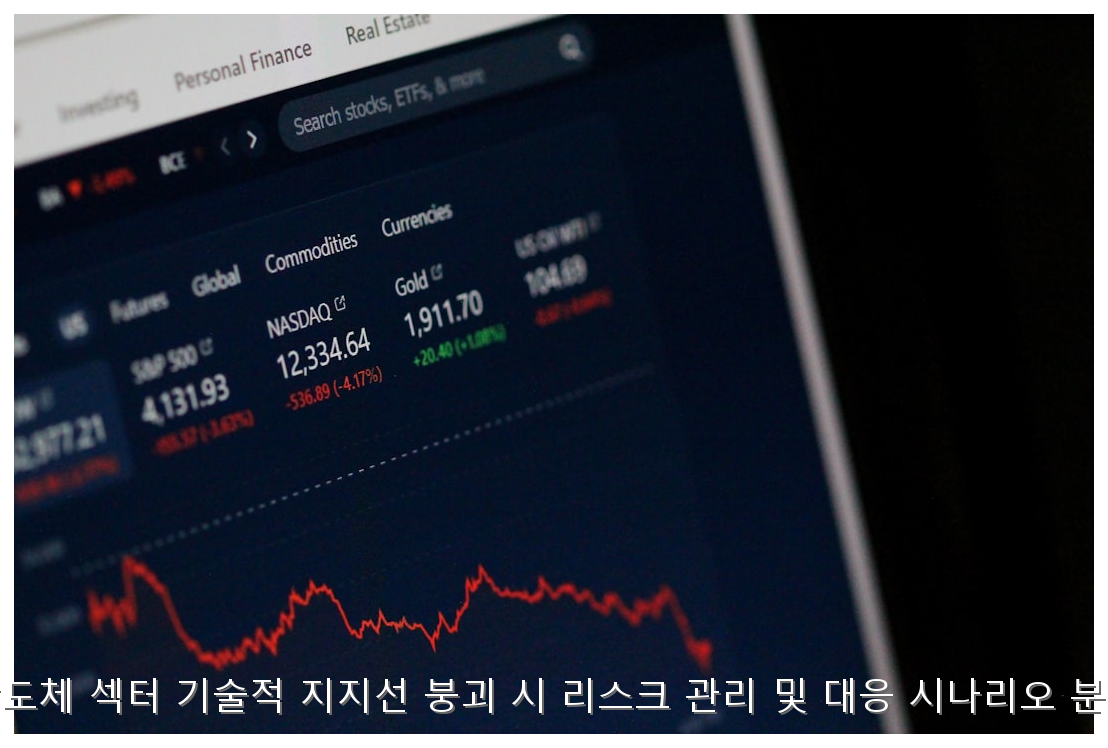
현금 비중 확보 후 재진입 타점 잡기
Strategies for re-entering the market after a support breakdown, focusing on the 'W-bottom' pattern.
⚖️ 투자 책임 고지
본 리포트는 데이터 분석 기반의 정보 제공을 목적으로 하며, 특정 종목에 대한 매수/매도 권유가 아닙니다. 모든 투자의 결과는 투자자 본인에게 귀속됩니다.© 2026 Richline Economy. All rights reserved.



0 댓글